New month, yet another record

R
ggplot2
climate change
global temperature
Author

Jim Milks

Published

November 15, 2023

Stop me if you’ve heard this before but we’re on a run of record warm months. Since June, every single month has been the hottest ever for that month. The hottest ever June. The hottest ever July, August, September. Now add October to that list.

Show the code
library(tidyverse)

GISS.og <- read_table("https://data.giss.nasa.gov/gistemp/tabledata_v4/GLB.Ts+dSST.txt", 
                   skip = 7,
                   na = c("***", "****")) %>%
        filter(!row_number() %in% c(22,43, 64, 85, 106, 127, 148)) %>%
        filter(row_number() <= n() - 5)

GISS <- GISS.og %>%
        select("Year",
               "Jan",
               "Feb",
               "Mar",
               "Apr",
               "May",
               "Jun",
               "Jul",
               "Aug",
               "Sep",
               "Oct",
               "Nov",
               "Dec") %>%
        pivot_longer(!Year, 
                     names_to = "Month", 
                     values_to = "anomaly") %>%
        mutate(anomaly = as.numeric(anomaly),
               anomaly = anomaly / 100,
               Year = as.numeric(Year))

GISS$Month <- match(GISS$Month, month.abb)
GISS$Date <- make_date(year = GISS$Year, month = GISS$Month, day = 1)

GISS %>%
        mutate(Year = factor(Year),
               Date = update(Date, year = 1)) %>%
        ggplot(aes(x = Date, y = anomaly, colour = Year)) +
        scale_x_date(date_breaks = "1 month", date_labels = "%b") +
        geom_line(aes(group = Year), colour = "black", alpha = 0.1) +
        geom_line(data = function(x) filter(x, Year == 2016), lwd = 0.5) +
        geom_line(data = function(x) filter(x, Year == 2019), lwd = 0.5) +
        geom_line(data = function(x) filter(x, Year == 2023), lwd = 1) +
        theme_bw() +
        labs(title = "Global surface temperatures anomalies 1880-2023",
             subtitle = "NASA GISS, 1951-1980 baseline",
             x = "Month",
             y = "Surface temperature anomaly (ºC)")

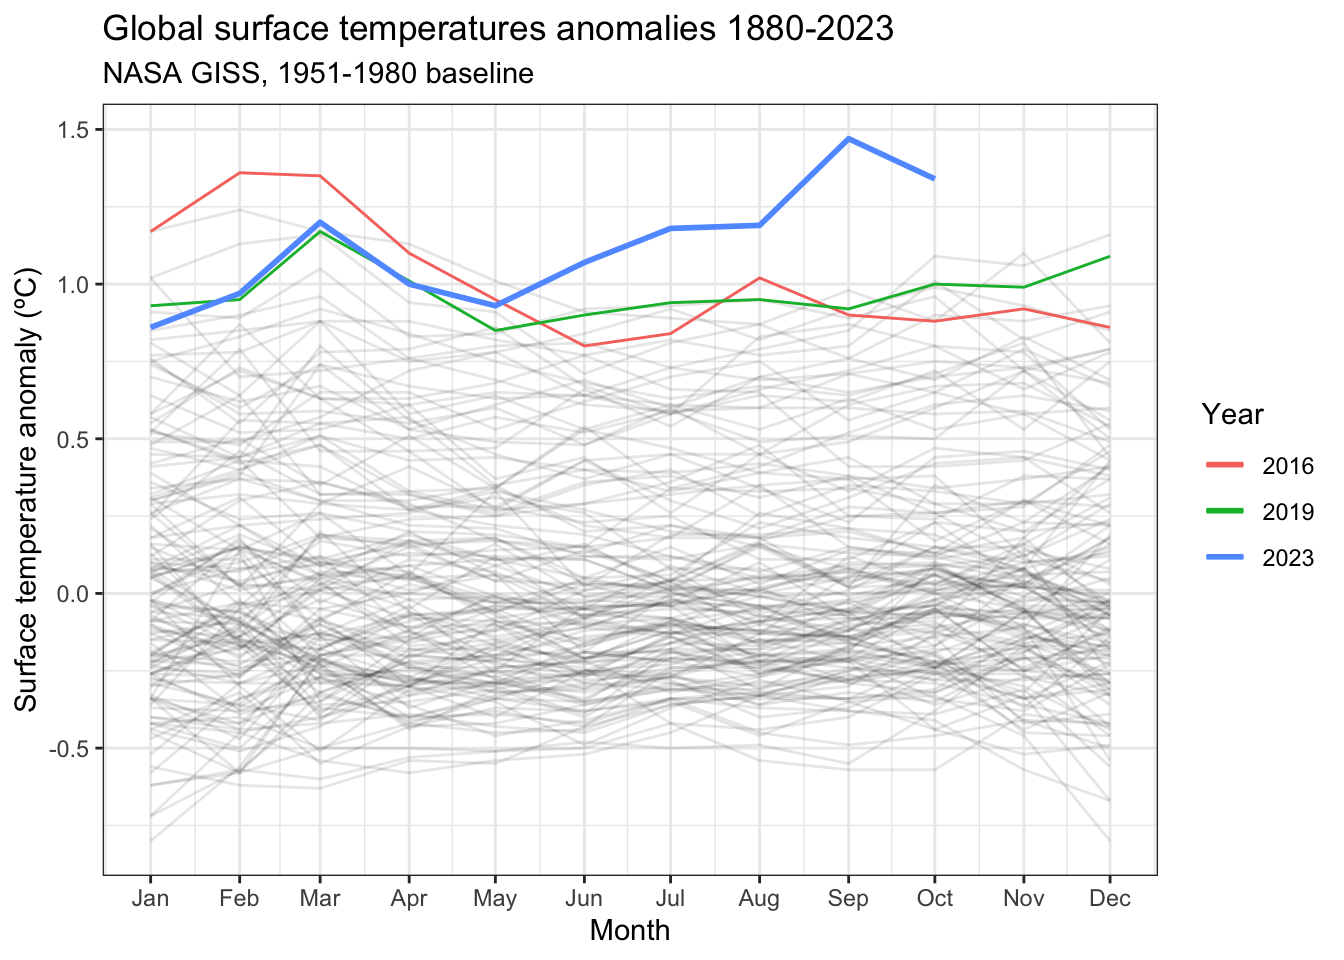
The previous record holder was October 2015, which came in at 1.09ºC above the 1951-1980 baseline. That’s a full 0.25ºC below October 2023’s 1.34ºC anomaly. At this point, I think we can call it: 2023 will go down as the hottest year ever.

It’s not just the five month streak of hottest ever months—it’s how those months are destroying the previous records. Just look at the seasonal graph. That’s a lot of daylight between the 2023 months and their colder counterparts, as much or more daylight than 2016 had over its colder counterparts when it set the record.

And remember: This is without the full effects of a strong El Niño. What we’re seeing now is what happens once La Niña takes it foot off the brake. We still haven’t seen what will happen once El Niño steps on the accelerator. Hold on to your hats.


Comment Section

Notes, suggestions, remarks? Feel free to leave a comment below.